Rising Fuel Costs in 2026: What It Means for Field Teams
Fuel is back at the top of the operating cost sheet. How to see the impact before it reaches your margins.
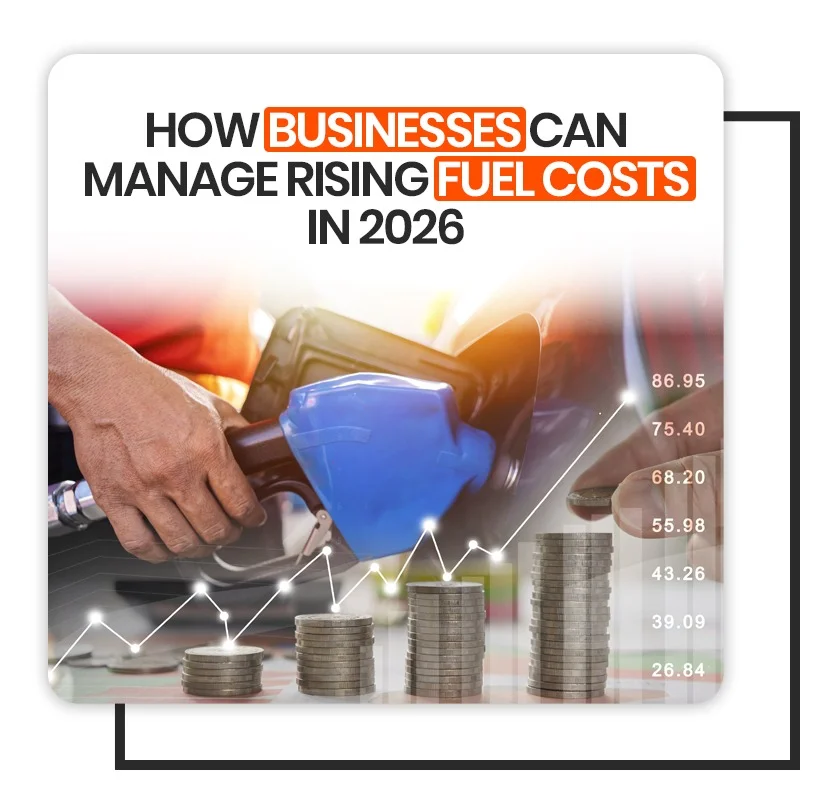
When fuel gets more expensive, most organisations look at the fuel line in the accounts and conclude the damage is manageable. It usually is not, because fuel does not stay on the fuel line. It leaks into reimbursements, allowances, distribution charges and supplier pricing, and by the time it reaches the P&L it has been renamed four times.
This is a piece about finding those costs before they compound — and about the uncomfortable fact that most companies cannot answer basic questions about their own field operations.
Where the cost actually hides
Start with an audit of every place fuel enters your cost base indirectly. For most organisations with people in the field, the list looks something like:
- Mileage reimbursement. Usually a per-kilometre rate that was set some time ago and has not been revisited since.
- Fixed conveyance allowances. Paid monthly regardless of actual travel, so they absorb increases invisibly.
- Owned or leased fleet. The only line most people actually watch.
- Third-party distribution. Where fuel surcharges arrive as a revised rate card rather than a fuel cost.
- Supplier pricing. Delivered goods carry their supplier's freight, which carries their fuel.
The first two are where the damage tends to be worst, because they are administered rather than managed. Nobody owns them the way somebody owns the fleet budget.
Key takeaway
If your fuel exposure sits mostly in reimbursements and allowances rather than a fleet line, cutting the fleet budget will not help. You have to fix the claim process, and that is an HR and finance problem before it is a logistics one.
Measure before you cut
The instinct when costs rise is to reduce the rate or cap the allowance. This is fast, visible, and frequently counterproductive — it moves cost onto employees, damages retention among exactly the field staff who are hardest to replace, and does nothing about the underlying inefficiency.
A better sequence is to establish two numbers first:
- Cost per field visit. Total travel-related spend for a team divided by completed visits. This is the number that tells you whether the problem is price or productivity.
- Distribution of that cost. Cost per visit by person and by region. Averages hide the outliers, and the outliers are where the recoverable money is.
Most organisations find a wide spread. When one representative's cost per visit is triple another's covering comparable territory, that gap is rarely about fuel prices. It is about routing, scheduling, or a claim process nobody checks.
A rising fuel price does not create inefficiency. It just makes existing inefficiency expensive enough to notice.
Four levers that actually move the number
Plan visits in clusters, not in sequence
Field schedules often get built chronologically — whoever asked first gets the earliest slot — which produces routes that criss-cross a city. Grouping by geography rather than by request order typically takes a meaningful bite out of distance travelled without reducing the number of visits.
Verify presence at the location, not just the day
Reimbursement claims are hard to check when the only evidence is a form. Geo-tagged attendance changes this quietly: a check-in carries a location and a timestamp, so a claim can be validated against where someone actually was. The point is not surveillance; it is that a verifiable claim can be approved instantly instead of sitting in a queue while somebody wonders about it.
Move the policy into the claim form
Policies enforced by a human reading a PDF get enforced inconsistently. Policies encoded in the expense system — rate per kilometre, distance caps, required approvals above a threshold, receipt rules — get enforced identically every time, and the exceptions surface for review rather than slipping through.
Ask whether the trip needed to happen
The cheapest kilometre is the one not driven. A share of routine field visits are status checks that a call or a photo upload would resolve. Reviewing visit types against outcomes usually finds a category that can move to remote handling without anyone objecting.
Making the review a habit rather than a fire drill
Fuel prices move. Treating each move as an emergency produces reactive policy changes that get reversed six months later. A standing monthly review is calmer and works better. Three things belong on it:
- Cost per visit, trended, by region.
- The top and bottom decile of claimants, with a look at what is different about them.
- Reimbursement rates against current pump prices, so adjustments happen on a schedule rather than after a complaint.
That last point matters more than it sounds. Rates that lag reality for months erode trust, and rates that get corrected only when someone escalates teach people to escalate.
What to do this quarter
If you do nothing else: get cost per field visit calculated for one team, look at the spread across individuals, and talk to the person at each end of it. That single exercise usually surfaces both a process fix and a rate that needs updating — and it costs a morning.
The organisations that handle a fuel spike well are not the ones with the tightest policy. They are the ones who could see the effect within a month instead of finding it in the annual accounts.
Where fuel cost is tied to staff movement, the controls belong in the HCM software — travel requests, advances and their payroll settlement held against one record.